 SkyyCast
A page can score in the nineties on a synthetic speed test and still feel sluggish to the people using it. That gap — between a tool running on a fast machine and a real visitor on a mid-range phone and a patchy connection — is the problem Core Web Vitals were built to describe. They are three metrics, collected from real Chrome users out in the world, that try to capture how a page feels while it loads and while you interact with it.
The three are Largest Contentful Paint (LCP), Interaction to Next Paint (INP) and Cumulative Layout Shift (CLS). Each one measures a different kind of friction: waiting for content, waiting for the page to react, and content moving under your finger.
Largest Contentful Paint: how fast the main thing shows up
LCP measures the moment the largest piece of content in the viewport finishes rendering — usually a hero image, a video poster frame, or a big block of heading text. It is a proxy for the question “when does this page look ready?”
The reason LCP is defined around the largest element rather than the first pixel is that the first pixel is easy to game. A site can paint a background colour and a logo instantly while the actual article is still three seconds away. LCP waits for the content that dominates the screen.
Interaction to Next Paint: how quickly the page answers
INP looks at interactions — taps, clicks, key presses — and measures the time from the input to the next frame the browser paints in response. It reports a value near the worst interaction on the page, so one janky menu can define the score for the whole visit.
INP replaced First Input Delay (FID) as a Core Web Vital in March 2024. FID only measured the delay before an event handler started; INP measures the whole round trip, including the handler running and the browser rendering the result. It is a stricter, more honest number.
Cumulative Layout Shift: how much the page jumps
CLS adds up the unexpected layout shifts that happen during the page’s life — the ones you did not cause by tapping something. The classic example is going to tap a link, an ad loading in above it, and your tap landing on the wrong thing. CLS is a unitless score based on how much of the viewport moved and how far.
What counts as “good”
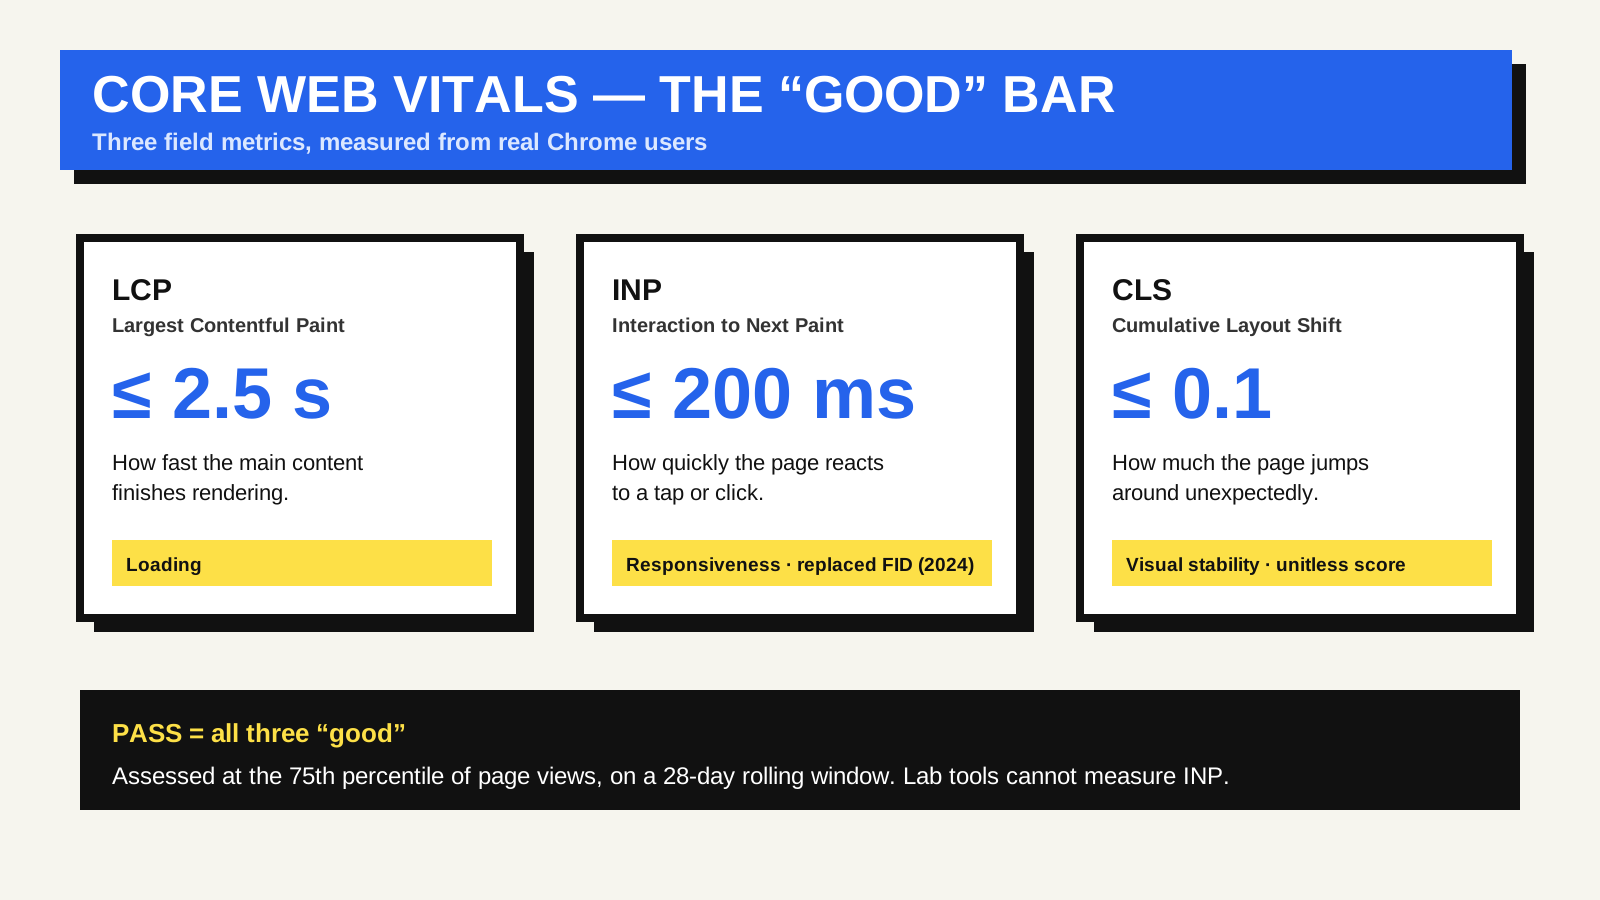
Google publishes a threshold for each metric, and the target is the 75th percentile of page views: if at least 75% of visits to a page — or a whole site, at the origin level — meet the “good” bar, that metric is classed as good.
- Largest Contentful Paint (LCP) — good: 2.5 seconds or less; needs improvement: 2.5 to 4 seconds; poor: over 4 seconds.
- Interaction to Next Paint (INP) — good: 200 milliseconds or less; needs improvement: 200 to 500 milliseconds; poor: over 500 milliseconds.
- Cumulative Layout Shift (CLS) — good: 0.1 or less; needs improvement: 0.1 to 0.25; poor: over 0.25.
The thresholds are not arbitrary. Google’s own write-up on how the Core Web Vitals thresholds were defined explains that each bar sits where research suggests users start to perceive a problem, and where a meaningful share of sites already manage to hit it — demanding but not theoretical.
Why your Lighthouse score disagrees with your field data
Two different measurements are usually in play. Lab data — Lighthouse, the browser’s Performance panel, PageSpeed Insights’ analysis mode — runs one simulated load on a throttled connection. Field data — the Chrome User Experience Report, or your own real-user monitoring — is the 28-day rolling record of what actual visitors experienced.
They can disagree for good reasons. Lab tools cannot measure INP at all, because no real person is tapping anything; they estimate a related metric called Total Blocking Time instead. Field LCP depends on your visitors’ devices, networks and cache state, none of which a single lab run captures. When the two conflict, field data is the one Search uses, and the one worth chasing.
What actually moves each metric
LCP comes down to how fast the LCP element can be discovered, fetched and painted. The usual wins are a quicker server response, removing render-blocking CSS and JavaScript from the head, serving the LCP image in a modern format at the right size, and not lazy-loading it. If your hero image is marked loading="lazy", the browser deliberately delays the most important asset on the page. Format choice matters here too — see our comparison of JPEG, PNG, WebP and AVIF.
INP is almost always a main-thread problem. Long JavaScript tasks — heavy framework hydration, third-party tags, an expensive scroll or input handler — block the browser from responding. Breaking work into smaller chunks, deferring anything not needed for the first interaction, and trimming unused script are the levers. A very large DOM makes every interaction more expensive to render, so component-heavy pages tend to struggle.
CLS is the most fixable of the three. Set an explicit width and height, or an aspect-ratio, on images, videos and iframes so the browser reserves space before they load. Reserve space for ads and embeds. Load web fonts so they do not cause a jarring swap. Avoid injecting content above something the reader is already looking at.
Where Core Web Vitals sit in Google Search
Core Web Vitals are part of what Google calls page experience — a set of usability signals that also includes serving over HTTPS and avoiding intrusive interstitials. Google has been consistent that page experience is a relatively lightweight, tie-breaker-style factor: it can help a page edge ahead of a close competitor, but it will not rescue thin or unhelpful content, and strong vitals will not by themselves lift a page several positions.
The Search Central documentation on Core Web Vitals is explicit that helpfulness comes first. That is not a reason to ignore them, though: the same fixes that improve your vitals — smaller pages, fewer blocking scripts, stable layouts — also reduce bounce and make the site cheaper to serve.
A short working checklist
- Measure field data, not just Lighthouse. PageSpeed Insights shows both side by side.
- Fix the worst metric first — a page only passes when all three are good.
- Give every image, video and iframe explicit dimensions.
- Do not lazy-load the LCP image; consider marking it high priority with fetchpriority.
- Audit third-party scripts — they are the most common INP and LCP culprits.
- Re-check after about four weeks. Field data updates on a 28-day rolling window, so real changes take time to show.
Common questions
Is First Input Delay still a Core Web Vital?
No. INP replaced FID as a Core Web Vital in March 2024, and FID was subsequently retired from Google’s tooling and reports.
Do Core Web Vitals directly increase rankings?
They are a ranking signal, but a small one, grouped under page experience. Relevance and content quality carry far more weight.
How long after a fix will my scores change?
Field data is a 28-day rolling average, so a genuine improvement usually takes a few weeks to fully appear in the Chrome User Experience Report and in Search Console.
Which tools give me real-user data?
Search Console’s Core Web Vitals report, the CrUX dashboard, and any real-user monitoring you add to the site. Lighthouse and the Performance panel are lab tools and cannot measure INP.